
«Infogram», a leading web–based visual communications company, has announced the latest version of its award–winning data visualization platform.
Founded in 2012, based in Latvia and recently acquired by presentation platform «Prezi», «Infogram» is a data visualization tool that helps one to create interactive charts, infographics and maps. It has exploded in popularity and emerged as an innovator in the area of data visualization and rapidly became the web’s favourite data visualization tool thanks to its simplicity, functionality and strong design aesthetic — over 3 million users who have created charts and infographics that have been viewed over 1.5 billion times.
Designed to give business teams the best design experience possible, the new version of data visualization platform allows users to more easily and quickly create interactive infographics, reports, charts and other visual elements to more effectively convey complex ideas. With simple drag–and–drop functionality, «Infogram’s» updated platform provides more creative freedom, a wider variety of outputs, and over 40 effortless designer templates to make communications more engaging and effective.
What’s new in «Infogram»
The latest version of «Infogram» was designed to help customers create a much wider range of visuals — from assets for marketing and social campaigns to reports and web pages. «Infogram» makes it easier than ever for business teams to collaborate, visualize, and share data.
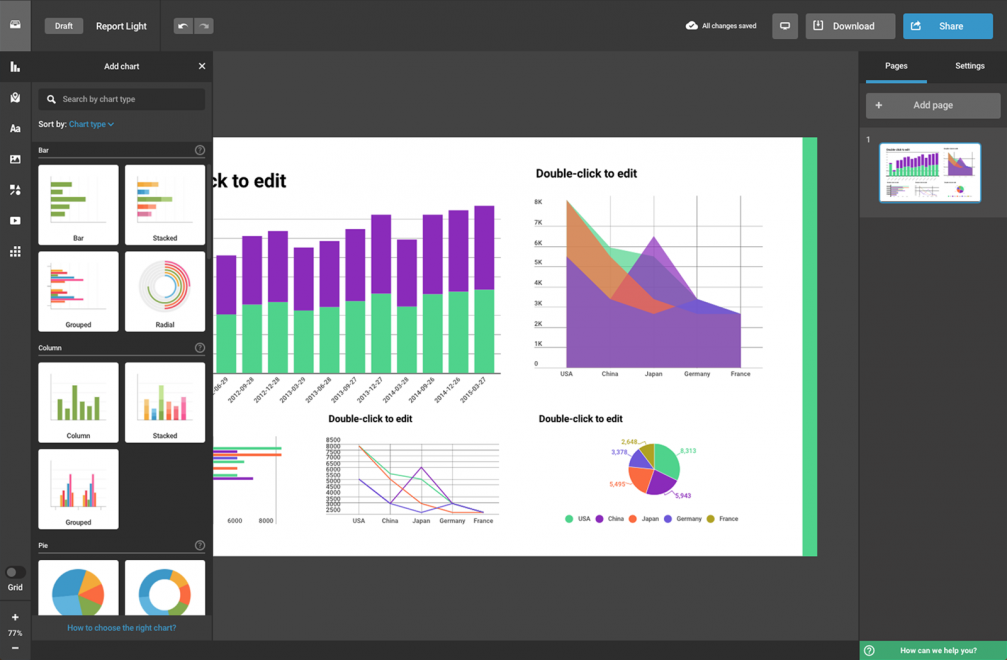
An intuitive drag–and–drop editor
The editor helps professional teams easily create interactive reports and visuals. Users can add, arrange, and resize various visual elements to create stunning content in minutes. Users can also simply copy and paste, upload a spreadsheet, connect to various Cloud services, or take advantage of «Infogram’s» API for live updates.
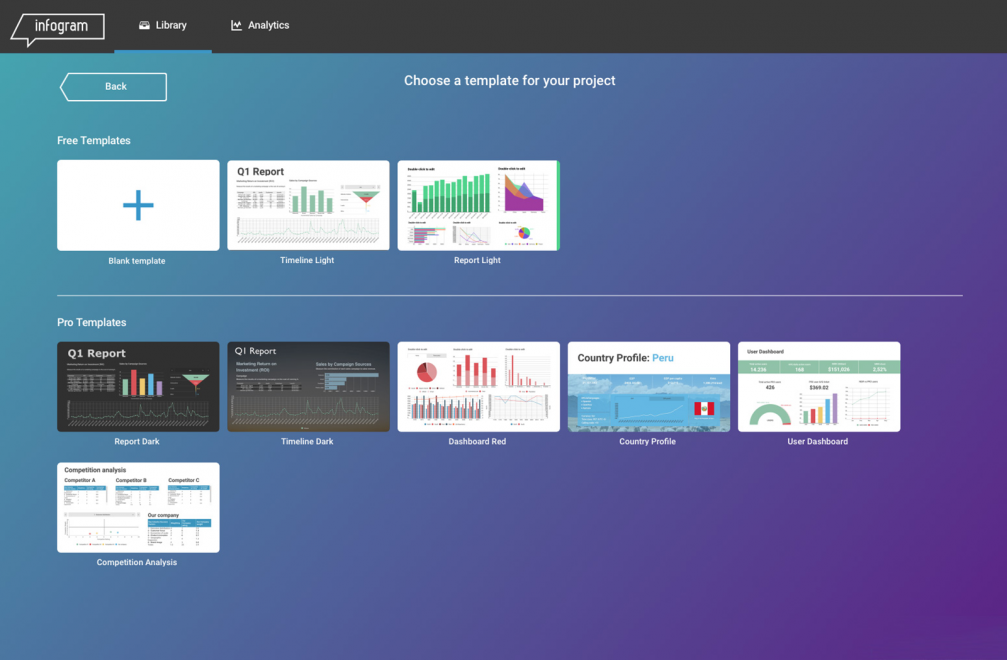
Over 40 new designer templates
The templates make it easy for users to turn ideas and data into engaging content. Users can select their own colour palette, adjust fonts, duplicate projects, upload logos, add media, and stay on brand. This update complements the company’s previous efforts to provide teams with the features needed to create custom projects and adhere to company brand guidelines.
Social media support
«Infogram» now provides size templates for Facebook, Twitter, Instagram, Pinterest. Users can also easily add visual elements to social media posts on major social media platforms.
«Our aim was to expand the functionality of «Infogram» according to the way how the user uses data visualization,» emphasizes Jānis Godiņš, Head of product design at «Infogram». «We did research and explore user experience of our product and these observations allowed us to conclude that «Infogram» is frequently used to prepare reports, dashboards, presentations, and social media posts. Until this day, «Infogram» offered mostly media focused data visualization to use on web platforms, while now we have improved by expanding the data visualization possibilities to ensure it can be done easier and much faster,» says Godiņš.


Viedokļi